
US retail website performance study 2021

In February 2021, I conducted a study into the performance of US retailer websites, measuring their response times, page load speeds and web vitals.
Table of Contents
Methodology
- Take the largest retailers by revenue according to the National Retail Federation Top 100 Retailers list
- Exclude grocery retailers on basis that these are often not ecommerce sites, or are new to ecommerce, but retain Kroger as a representative of this group
- Exclude restaurants on basis these are not often ecommerce sites, but retain McDonald's as a representative of this group
- Remove Best Buy as this site has protection from automated testing
- Remove 7-Eleven and Ross Stores as these are stores-focused businesses
- Take the twenty largest retailers from the list that remains
- Choose the home page URL, choosing the TJMaxx brand in the case of TJX Companies
- Perform website performance testing on a Sunday morning, at a time when consumer traffic would be low
- Run each website through the performance measuring tools available at Webpagetest by Catchpoint and record the output for analysis
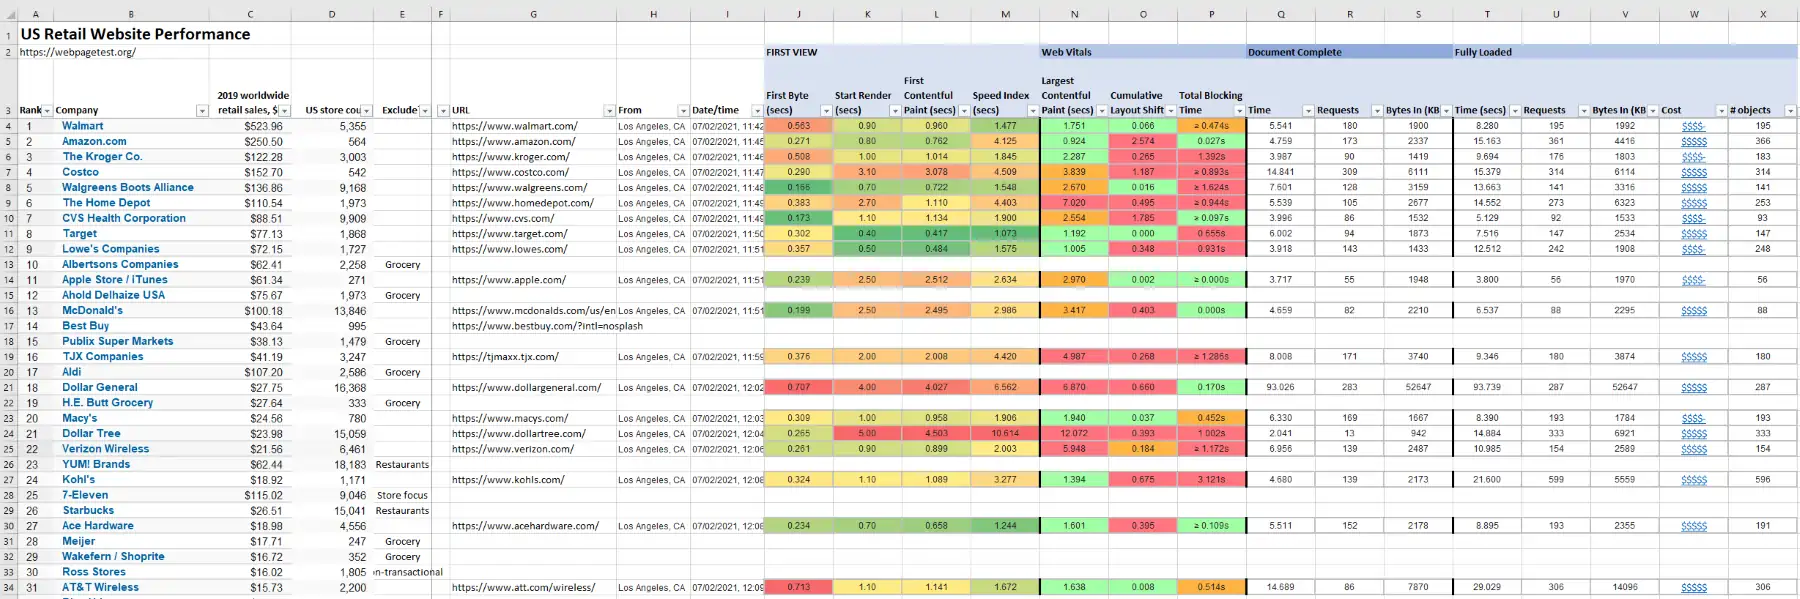
Surveyed Retailers
The list of retailers surveyed in this study is:
| Retailer | 2019 Worldwide Revenue, $bn | US Store Count |
| Walmart | $523.96 | 5,355 |
| Amazon.com | $250.50 | 564 |
| The Kroger Co. | $122.28 | 3,003 |
| Costco | $152.70 | 542 |
| Walgreens Boots Alliance | $136.86 | 9,168 |
| The Home Depot | $110.54 | 1,973 |
| CVS Health Corporation | $88.51 | 9,909 |
| Target | $77.13 | 1,868 |
| Lowe's Companies | $72.15 | 1,727 |
| Apple Store / iTunes | $61.34 | 271 |
| McDonald's | $100.18 | 13,846 |
| TJX Companies | $41.19 | 3,247 |
| Dollar General | $27.75 | 16,368 |
| Macy's | $24.56 | 780 |
| Dollar Tree | $23.98 | 15,059 |
| Verizon Wireless | $21.56 | 6,461 |
| Kohl's | $18.92 | 1,171 |
| Ace Hardware | $18.98 | 4,556 |
| AT&T Wireless | $15.73 | 2,200 |
Source: NRF
Data captured
Data captured in the study included:
Time to first byte - how long did it take for the website to return any data at all
Start render - how long did it take for the page to start rendering
Largest contentful paint (LCP) - how long before the largest amount of content was painted to the browser screen
Cumulative layout shift (CLS) - to what extent did the browser later adjust the position of items on the screen after they had first been rendered
Number of requests / bytes - how many objects were fetched to render the page and how many kilobytes of data was this
The above statistics (and more) were captured both for a simulated first visit to the website and then a repeat visit (returning visitor) when much of the content should have been cached by the browser to avoid a second download.
Highlights Of The Study Results
Good Performers
The largest retailers in the study, Walmart, Amazon and Kroger, all performed well, with sites that responded quickly, optimized image sizes, and made good use of caching to make repeat visits even faster.
Poor Performers
TJX, Dollar General and Dollar Tree were the worst performing sites with poor response times, and significant layout shifts occurring several seconds after the sites started to load.
Most Shocking Mistake
Dollar General in particular had a shocking mistake on their site. Two JPEG images for their Valentine's Day marketing campaign between them accounted for 44MB of data downloaded to render the home page. One image was a whopping 6720 x 4480 pixels, with metadata still showing it was captured on a Canon EOS 5D Mark IV with an F-Stop of f/13 and 1/125 sec exposure time. This meant a visitor to the Dollar General home page needed to download 52,647 KB of data to fully render it. This rookie error caused the home page to take 93 seconds to fully complete in our test, dwarfing the next slowest site by over a minute.
Excessive Object Count
The Kohl's home page required the most objects (images, CSS files, JavaScript, etc.) with a stunning 596 objects downloaded. While that number reduced to 212 for a repeat visitor, this was still almost twice as many as the next highest figure of 366 for Amazon and over ten times the number required for the slimline Apple home page that had a characteristically pared down look with only 56 objects.
Best and Worst Time To First Byte
McDonald's recorded the fastest time to first byte - the time taken to start to receive any data from the website at a very speedy 0.149 seconds. Apple and Costco were only a few milliseconds behind.
AT&T Wireless had the poorest performance at 0.713 seconds, which actually worsened to 0.740 seconds on the second run. Walmart was not much better at 0.563 seconds on the first run and 0.6124 seconds for the repeat visit.
Largest and Smallest Web Pages
As mentioned above Dollar General had the largest web page at 52,647 KB with the next largest being AT&T Wireless at 7,870 KB. These figures improved to 3,814 KB and 846 KB respectively on the second visit, to record excellent ratios of 7.2% and 6.0% compared to their first loads.
Dollar Tree had the smallest web page at 942 KB with the next smallest being Kroger at 1,419 KB. On a repeat visit, Dollar Tree registered a miniscule 21 KB compared to Kroger at 304 KB, both at an acceptable 18% ratio compared to their first visit sizes.
Best and Worst Cumulative Layout Shift
Target and Apple both had essentially zero CLS figures, meaning their web teams have carefully ensured their home pages are sized and laid out correctly and not subject to disruptive layout changes as images and other content is loaded. AT&T and Walgreens also had very good scores for this metric.
Surprisingly given their dominance in web commerce, Amazon scored the worst value for CLS, with Costco and CVS also notably poor performers. This was as true for all three on the repeat visit tests.